
Reviewed captions compare standard deviations by considering distances from each distribution’s mean.
Start with distance from the center
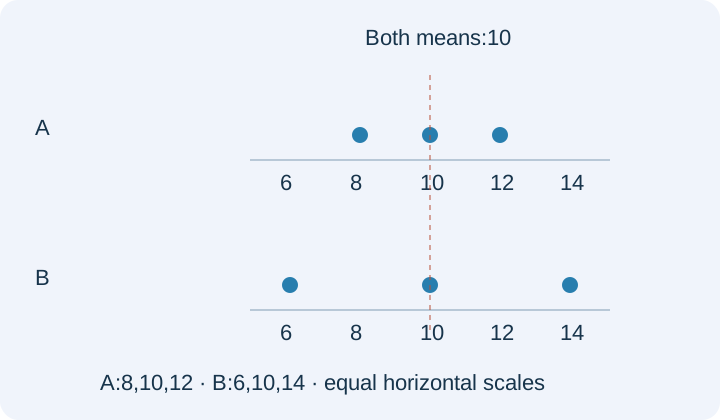
Two groups can have the same average and very different consistency. Suppose group A records measurements 8, 10 and 12, while group B records 6, 10 and 14. Each group has mean 10. Yet group B places its outer observations farther from that shared center. Before calculating a formula, describe that difference in words and locate it in the original dot plots below.
The linked video compares standard deviations visually by examining how observations sit relative to their means. We read its available captions from 0 to 229 seconds. Its displayed arrangements are not fully encoded in the captions, so our diagrams use newly authored data rather than reconstructing the source plots. The numerical checks below are our instructional extension of the comparison method, with full audiovisual review still pending.
Compare a controlled change
In group A, deviations from the mean are −2, 0 and 2. In group B, they are −4, 0 and 4. Every deviation has doubled, so the standard deviation has doubled as well. Both groups contain three observations, and their corresponding points move symmetrically around an unchanged mean. Those controlled conditions let us make the comparison without confusing a change of center with a change of spread.
The first figure uses one common horizontal scale for both groups. The dots at 8 and 12 in A correspond to dots at 6 and 14 in B. The middle dot stays at 10. If two diagrams use different axis scales, apparent width alone can mislead. Read the tick labels before comparing visual spread, especially when the same drawing width represents different numerical intervals.
Use a formula as a check, not a replacement for meaning
For these lists treated as complete populations, variance is the average squared deviation from the population mean. Group A has variance (4+0+4)/3=8/3. Group B has variance (16+0+16)/3=32/3. Standard deviation is the nonnegative square root of variance, so the ratio of their standard deviations is the square root of 4, or 2. The units of variance are squared measurement units; standard deviation returns to the original units.
It is useful to think of standard deviation as a measure of typical distance, but it is not the ordinary average of absolute distances. For group A, the mean absolute deviation is 4/3, while the population standard deviation is the square root of 8/3. Different definitions can rank some simple examples similarly without being interchangeable. PSAT comparisons focus on understanding spread; the explicit calculation here makes the distinction checkable.
Move the whole distribution without stretching it
Now add 10 to every observation in group A. The new list is 18, 20 and 22, with mean 20. Each deviation from that new mean is still −2, 0 or 2. The standard deviation therefore remains unchanged. A larger mean has not produced greater spread. Location and variation answer different questions and can change independently.
Contrast this with multiplying each original observation by 3. The new values are 24, 30 and 36, and their mean is 30. Their deviations are −6, 0 and 6, so standard deviation is three times the original. Adding a constant cancels when subtracting the mean; multiplying scales the deviations. For a negative multiplier, the distribution also reflects, while standard deviation scales by the multiplier’s absolute value.
Equal range does not settle the comparison
Consider list C=[6, 10, 10, 10, 14] and list D=[6, 6, 10, 14, 14]. Both lists have five observations, mean 10 and range 8. List D nevertheless puts more observations at the extremes. Its population variance is 64/5, while list C has variance 32/5. Therefore D has the greater standard deviation even though both endpoint values and the range agree.
This example explains the information that range discards: it uses only the smallest and largest values. Standard deviation uses every observation’s distance from the mean. When reading a dot plot, count repeated dots as separate observations. A stack of three dots at 10 is not interchangeable with one dot there, and ignoring multiplicity can change both the center and the spread.
Make a claim you can justify
For a transfer check, compare [3, 5, 7] with [13, 15, 17]. Their means differ by 10, but both have deviations −2, 0 and 2, so their standard deviations are equal. Now compare [3, 5, 7] with [1, 5, 9]. The second set has double the deviations about the same mean, and therefore double the standard deviation. State the transformation rather than relying on a vague claim that one list looks larger.
Visual reasoning is strongest when you can identify what stayed fixed and what changed. If observations move asymmetrically, the mean may move too, and distances must be reconsidered relative to that new mean. Do not generalize a symmetric example into a rule that every outward-looking movement has the same effect. For PSAT data questions, track the center, scale, multiplicity and comparison being requested before choosing a response.
PAUSE & TRYDo[3,5,7]and[13,15,17]have different standard deviations?Reveal explanation
No. Both have deviations−2,0,2from their own means.
Turn the idea into practice.
A fresh set will help you use the relationship with different numbers.
Practice this skillEvidence & editorial note
Fresh English captions read0–229seconds. New examples and original diagrams; source plot layout is not reconstructed. Full audiovisual and educator review pending.
Brief source synopsis plus independently authored numerical teaching companion.
Caption track SHA-256: 63dff6e9c1a183a524730e90cefe54307dd6c430964b92d9729fb909ecfbe34d
Source segment references are retained in the catalog. Full captions remain in the local research archive.