All examsAP StatisticsFoundation path
View coverage
FREE ORIGINAL PRACTICE · ANSWERS & EXPLANATIONS

AP Statistics Practice Questions & Answers

Explore variability, design a fair investigation, and explain what a statistical result actually says.

Read 10 original sample questions with worked explanations before opening the practice studio. These examples introduce selected topics from this AP Statistics foundation path.

Free access · No sign-up · No personal progress recorded on this page

What this practice covers

2026–27 foundation pilot; editorial topic-level mapping, not official alignment certification

Original four-option conceptual and numerical practice plus numeric learning exercises. Not a replica of the fully digital AP free-response exam.

10 public examples400 question variants in the studio96 task families

Review status: Independent educator review and learner calibration are pending. Use these selected foundation examples alongside the coverage map and current official references.

Check the coverage map and remaining gaps
CHOOSE A STARTING POINT

Topics in this foundation path

The examples below span 5 of 5 learning domains. Counts describe the current catalog, not the exam's official weighting.

TRY A QUESTION. FOLLOW THE REASONING.

Sample questions with answers

Work out your answer first, then compare the explanation. This stable selection uses distinct task families across the available learning domains.

QUESTION 01Exploring and collecting data

Ask statistical questions

A study of 24 library visitors records the service-category label for each observation. How should this variable be classified?

  1. A sampling distribution
  2. Quantitative
  3. A population
  4. Categorical

Answer: Categorical

  1. Identify what is recorded for each observational unit.
  2. Ask whether numerical magnitude and differences have a meaningful interpretation.
  3. The recorded variable is categorical.
Compare the other answer choices
A population

Confuse the group being studied with the type of one recorded variable.

A sampling distribution

Confuse a recorded variable with the distribution of a statistic across repeated samples.

Quantitative

Treat a service label as if arithmetic on the label measured a quantity.

Reference basis: AP Statistics 2026–27 course framework. These are original learning questions, not questions reproduced from the references.

QUESTION 03Inference for proportions

Build and interpret intervals

A proportion estimate is 1/2 with SE = 1/50. Using multiplier 2, what is the upper interval endpoint?

  1. 27/50
  2. 13/25
  3. 29/50
  4. 1/25

Answer: 27/50

  1. Margin of error = 2 × 1/50 = 1/25.
  2. Add the margin to the estimate.
  3. Upper endpoint = 27/50.
Compare the other answer choices
13/25

Use one standard error and omit the critical multiplier.

1/25

Report a signed margin, omitting the estimate.

29/50

Use the full interval width as the margin.

Reference basis: AP Statistics 2026–27 course framework. These are original learning questions, not questions reproduced from the references.

QUESTION 04Inference for means

Compare groups carefully

Two independent groups have sample proportions 7/10 and 3/10. What is the estimated difference, first minus second?

Write a numeric answer.

Answer: 2/5

  1. Keep the direction of subtraction fixed.
  2. Subtract 3/10 from 7/10.
  3. The estimated difference is 2/5.

Reference basis: AP Statistics 2026–27 course framework. These are original learning questions, not questions reproduced from the references.

QUESTION 06Exploring and collecting data

Describe center and position

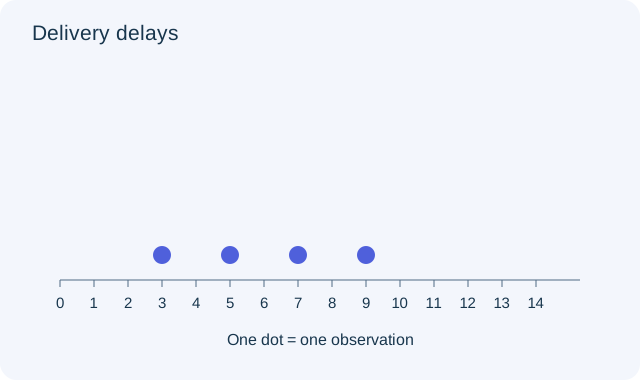
Use the delivery-delay dot plot. What is the mean delay in minutes?

Dot plot with one observation at each of 3, 5, 7, 9.Open full-size diagram ↗
  1. 24/5
  2. 8
  3. 9
  4. 6

Answer: 6

  1. Add the four delays: 24.
  2. Divide the total by 4: 6.
  3. The result describes the arithmetic center in minutes.
Compare the other answer choices
8

Use n−1, the sample-variance denominator, when finding a mean.

9

Report the maximum instead of the mean.

24/5

Count one extra observation in the denominator.

Reference basis: AP Statistics 2026–27 course framework. These are original learning questions, not questions reproduced from the references.

QUESTION 07Probability and distributions

Model repeated chance outcomes

X takes values 0, 1, and 2, with probabilities 1/4, 1/2, and 1/4. What is E(X)?

  1. 1
  2. 2
  3. 3/2
  4. 3/8

Answer: 1

  1. Multiply each value by its probability.
  2. The weighted sum is 0 + 1/2 + 2/4.
  3. E(X) = 1.
Compare the other answer choices
2

Use the largest possible outcome as the expectation.

3/8

Square each probability before weighting.

3/2

Compute E(X²) rather than E(X).

Reference basis: AP Statistics 2026–27 course framework. These are original learning questions, not questions reproduced from the references.

QUESTION 08Inference for proportions

Reason from a null model

For a one-proportion test, p0 = 1/2, observed proportion = 13/20, and the null standard error is 1/20. What is z?

Write a numeric answer.

Answer: 3

  1. Subtract the null proportion from the sample proportion.
  2. Divide by the null standard error.
  3. z = 3.

Reference basis: AP Statistics 2026–27 course framework. These are original learning questions, not questions reproduced from the references.

QUESTION 09Inference for means

Choose a t procedure from the study design

Four independently sampled participants have before scores [10, 20, 30, 40] and corresponding after scores [8, 22, 32, 42]. Assume the population of after-minus-before differences is approximately normal. For a one-sample t test of population mean change 0, what is the t statistic?

  1. 1/2
  2. -1
  3. 2
  4. 1

Answer: 1

  1. Form each participant difference, then compute its sample mean and sample SD before standardizing the mean change.
  2. Differences are [-2, 2, 2, 2]; their mean is 1. Squared deviations sum to 12, so sample variance=12/3=4 and SD=2. SE=2/√4=1, giving t=(1−0)/1=1.
  3. Why an alternative fails: Divide the mean change by the sample SD of differences, omitting the square-root-of-n adjustment.
Compare the other answer choices
2

Divide the difference SD by n rather than square root of n, making the standard error too small.

1/2

Divide the mean change by the sample SD of differences, omitting the square-root-of-n adjustment.

-1

Reverse the required difference order to before-minus-after; the mean changes sign while the sample SD and standard error do not.

Reference basis: AP Statistics Course and Exam Description, effective Fall 2026. These are original learning questions, not questions reproduced from the references.

QUESTION 10Regression analysis

Decide what a fitted line can support

A fitted line predicts fuel use from trip length observed only between 20 and 50 km. Its intercept is 6 liters. Which statement about the intercept is justified?

  1. It is the average residual for the observed trips
  2. It is the increase in fuel use per additional kilometer
  3. It is the algebraic prediction at zero km, outside the observed range
  4. It proves a zero-distance trip consumes exactly 6 liters

Answer: It is the algebraic prediction at zero km, outside the observed range

  1. Locate x=0 relative to the observed explanatory-variable range.
  2. The intercept has a formal meaning, but zero km was not represented by the observed trips.
  3. Why an alternative fails: Treat an unsupported extrapolated prediction as a certain observed outcome.
Compare the other answer choices
It proves a zero-distance trip consumes exactly 6 liters

Treat an unsupported extrapolated prediction as a certain observed outcome.

It is the increase in fuel use per additional kilometer

Confuse the intercept with the slope.

It is the average residual for the observed trips

The intercept is a model coefficient, not an average prediction error.

Reference basis: AP Statistics Course and Exam Description, effective Fall 2026. These are original learning questions, not questions reproduced from the references.

BUILD ON WHAT YOU NOTICED

Turn one question into a learning route

Start with the lesson linked to an unfamiliar topic, try a focused set in the practice studio, then return to the review cards. Your practice progress stays in this browser.

Scope, sources and review notes

Catalog scope record: . This records the saved content mapping, not a guarantee that every external rule is current.

  • Foundation pilot, not complete AP syllabus coverage or an official exam simulation.
  • 400 variants across 96 families; not independently calibrated item designs.
  • Practice includes numeric responses as learning exercises; official free responses require statistical reasoning and contextual justification.
  • No calibrated AP score prediction; independent educator review pending.
  • Broader inference procedures, authentic multi-focus free responses and full shared-stimulus exam sets need further development.
  • Foundation pilot, not full syllabus coverage or official simulation
  • Question variants are not independent question designs
  • Independent educator review pending
  • Evidence integrity and structure checks do not establish factual or audiovisual fidelity

Check the exam provider's current information for registration, test rules and official preparation materials. The exam guide collects the relevant official references.

REFERENCEAP Statistics 2026–27 course framework

Current syllabus facts and topic mapping; no source question reproduced

REFERENCEAP Statistics Course and Exam Description, effective Fall 2026

Verified official unit/topic identifiers for partial coverage mapping