
A reliable method
Compute a mean from the total divided by the count. Locate a median only after sorting. When quartiles are supplied, subtract Q1 from Q3 to find the interquartile range.
The common trap
The mean reacts to extreme values because it uses their magnitudes. The median is resistant but still changes when enough observations move across the middle position.
Make the connection
A relative frequency uses the correct group total as its denominator. When comparing groups of different sizes, counts alone may create a misleading impression.
Same center, different spread
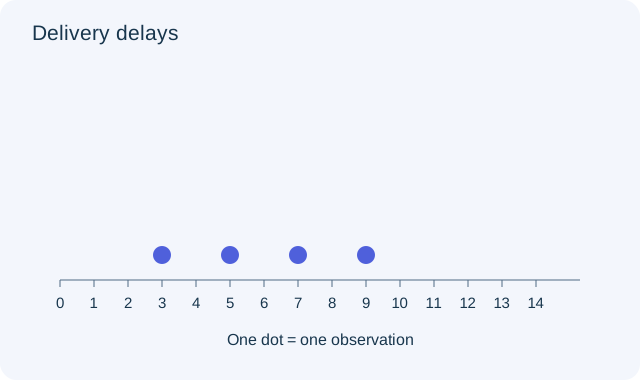
Compare 3, 5, 7, 9 with 0, 5, 7, 12. Both means and medians are 6, but the second set has a larger range. A correct average alone does not establish that two distributions are similar. Describe shape, unusual observations and spread alongside center. Always retain the original measurement units when interpreting a difference.
An outlier changes the choice
Replacing 9 by 29 in 3, 5, 7, 9 changes the mean from 6 to 11, but the median stays 6. The mean uses all magnitudes; the median uses order. Neither is always “better”: choose the summary that answers the question and explain why resistance matters in a skewed setting.
Transfer check
A box has Q1=5 and Q3=14, so IQR=9. Another has Q1=7 and Q3=13, so IQR=6. The first has a wider middle half; this does not by itself establish a larger mean, range or outlier count. Practise making only the comparison that the display supports.
Use the delivery-delay dot plot. What is the mean delay in minutes?
 Open full-size diagram ↗
- Add the four delays: 24.
- Divide the total by 4: 6.
- The result describes the arithmetic center in minutes.
Compare the other answer choices
Use n−1, the sample-variance denominator, when finding a mean.
Report the maximum instead of the mean.
Count one extra observation in the denominator.
Explain your thinking.
Optional written extension. Self-assessed only; it does not change your automatic practice result. These are teaching criteria, not official awarded marks.
After reading the plot: (a) Calculate its mean and median. (b) Replace the largest delay, 9 minutes, by 29 minutes and recalculate both. (c) Explain which measure is more resistant in this example.
This draft stays on this page only. Use paper if you want to keep your working.
Try it, then explain it.
Complete a short set without looking at the example. After each answer, explain which operation preserved the relationship and why the result makes sense.
Sources & authorship
Original Slope explanations and examples. References support the concepts; they are not the source of copied questions. Independent educator review is pending.
AP Statistics 2026–27 course framework