
The BACB outline includes measurement, summarizing data, graphing and reliable implementation. This independently written guide develops fictional examples to help distinguish the question answered by each measure; it is not a summary of a video or an actual client record.
Start with the boundary of one response
A number becomes useful only when another observer can understand what produced it. Before reaching for a tally counter or timer, identify the observable response, its onset and offset, the observation period, and the recording rule. A broad impression such as “had a difficult morning” does not supply those boundaries. A precise description can distinguish one sustained episode from several separate responses. In service delivery, the definition and procedure come from the assigned plan; a technician should raise an unclear boundary rather than silently invent a replacement.
The same physical event can support several valid measurements. The choice depends on what the team needs to know. This guide uses fictional situations to practice that distinction, not to prescribe which system a particular client should receive.
Compare a count with a rate
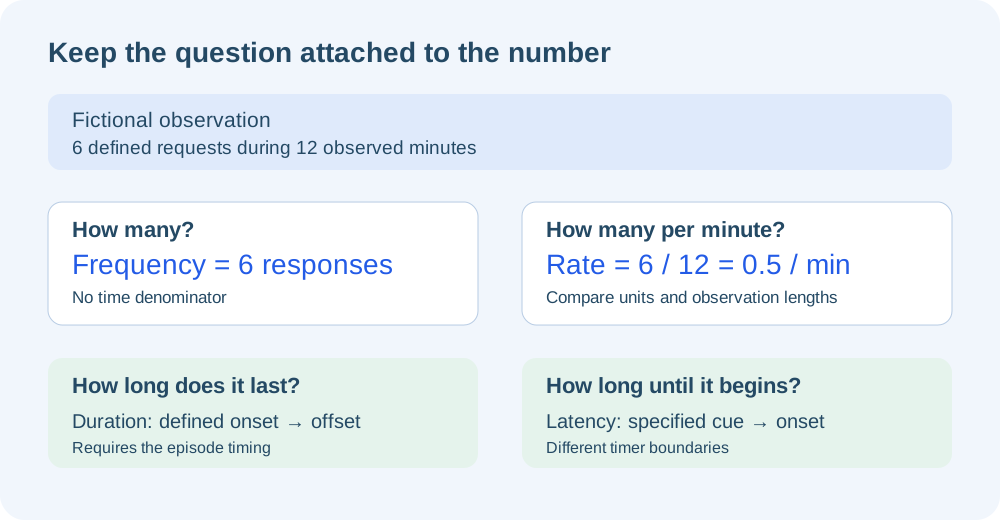
Imagine six defined requests during twelve observed minutes. The frequency is six responses. The rate is six divided by twelve, or 0.5 responses per minute. Now compare eight requests during eight minutes: there are eight responses and a rate of one per minute. The second observation contains both a greater count and a higher rate, but those are two different comparisons. A third observation with six requests in six minutes would keep the first count while changing the rate.
Write units next to every result. Dividing minutes by responses would answer the inverse question, and reporting the count alone would leave the unequal observation lengths unaccounted for. A rate comparison also assumes that the response definitions and observation methods are sufficiently comparable.
Give each timer its own start and stop
A cue occurs at 09:10:05. The learner begins the defined task at 09:10:14 and finishes at 09:10:44. Latency is the nine-second interval from the specified cue to response onset. Duration is the thirty-second interval from onset to completion. The full thirty-nine seconds from cue to completion combines two intervals; it is not the response duration in this example.
For interresponse time, read the convention supplied in the plan or question. An end-to-next-start convention measures a gap between episodes. Do not assume that an unlabeled clock value has the same meaning as another observer’s elapsed-time measure. State the boundaries before subtracting and check whether the requested result is one episode, a total, a mean or a percentage.
Do not turn interval scores into exact duration
A partial interval is scored occurrence when the defined response happens at any point in that interval. A whole interval requires it throughout the interval. Momentary time sampling examines the assigned instant. Each method reduces an observation to a specific kind of score. A response lasting briefly within every partial interval can produce a high occurrence percentage without occupying nearly all the observed time.
If six of twelve observed partial intervals are scored occurrence, fifty percent describes the intervals. It does not establish six responses or fifty percent exact duration. In a transfer task, ask what additional observation would be needed to answer “how many times?” or “for exactly how long?” The point is to preserve the distinction, not to select a supposedly universal best measurement system.
Read a graph before drawing a causal conclusion
Inspect the horizontal axis, vertical unit, observation schedule and condition labels. A graph of response counts cannot automatically be compared with a graph of responses per minute. A blank observation is not the same as a measured zero, and an axis change can alter the visual impression of a pattern. Enter and correct values through the assigned procedure rather than changing them to make a line smoother.
Describe what is visible before explaining why it occurred. A series can rise, fall or vary; those descriptions do not by themselves demonstrate a treatment effect or function. Bring the relevant pattern and contextual information to supervision. Good data make further judgment possible; they do not remove the need for an appropriately designed assessment.
Finish with a traceable transfer check
Try this independent arithmetic check. Three observed episodes last twelve, eighteen and thirty seconds. Their total duration is sixty seconds and their mean duration is twenty seconds per episode. If the observation period is ten minutes, the total occupies ten percent of those ten minutes. These summaries use the same events but different denominators and answer different questions.
Now imagine two minutes of that observation were missed. You cannot truthfully retain the same claim about complete ten-minute observation without explaining the gap. Document what is known, identify what was not observed, and ask how the incomplete record should be handled. Measurement integrity includes resisting the temptation to fill uncertainty with a precise-looking number.
Turn the idea into practice.
Apply the rule to a new case, then explain your choice.
Practice this skillSources & authorship
Original learning guide based on the BACB topic outline and supervised role description. Fictional examples and calculations are independently written; no video transcript, actual client record or official examination question is reproduced.
Original Slope explanations, examples and diagrams. References identify the outline and role boundaries; they do not constitute BACB endorsement or educator approval.
Independent educator review is pending. This guide is not an official exam paper or a video transcript.
RBT Test Content Outline3rd editionRegistered Behavior Technician official overview