
A reliable method
Compute total value times frequency and divide by total frequency for a mean. Use cumulative counts to locate the median positions.
The common trap
Do not divide a weighted total by the number of rows. A mean can be a value that nobody in the sample actually recorded.
Make the connection
Adding a constant shifts the mean and median by that amount but leaves the range unchanged. Use this to check transformed data.
Frequency weights change a mean
If value two occurs once and value five occurs twice, the mean is (2+5+5)/3=4. Averaging the two distinct values gives 3.5 and ignores their frequencies. For ordered data 1,2,8,9, the median is (2+8)/2=5. The range is 9−1=8, not the average of those extremes. Adding seven to every observation raises the mean and median by seven but preserves the range because both extremes shift equally. A result may be a number not originally observed; this is normal for means and even-sized medians.
Transfer, explain and check
Temperatures are −3,0,4,8. The range is 8−(−3)=11 and median is 2. After adding two to all four values, the range remains 11 and median becomes 4. Check both summaries directly.
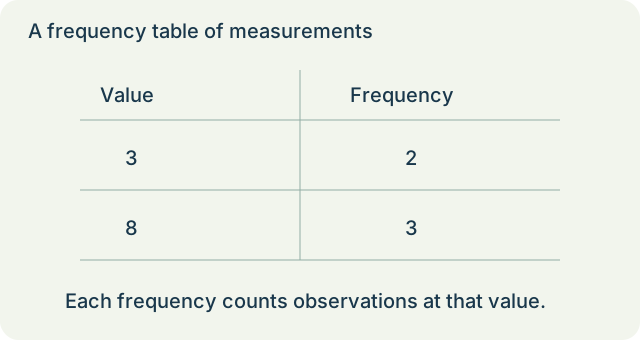
Use the frequency table. What is the mean measurement?
 Open full-size diagram ↗
- Compute the frequency-weighted total.
- There are five observations in all.
- Divide the total by five.
Compare the other answer choices
Return the most frequent value instead of the mean.
Divide the weighted total by row count rather than observation count.
Report the weighted total instead of the mean.
Try it, then explain it.
Complete a short set without looking at the example. After each answer, explain which operation preserved the relationship and why the result makes sense.
Sources & authorship
Original Slope explanations and examples. References support the concepts; they are not the source of copied questions. Independent educator review is pending.
Cambridge IGCSE Mathematics 0580