
Decision and conditions
Use frequencies, coordinates and endpoints to recover relationships from a graph. Graph scales and units are labeled. A fitted line need not pass through every observation.
Worked model
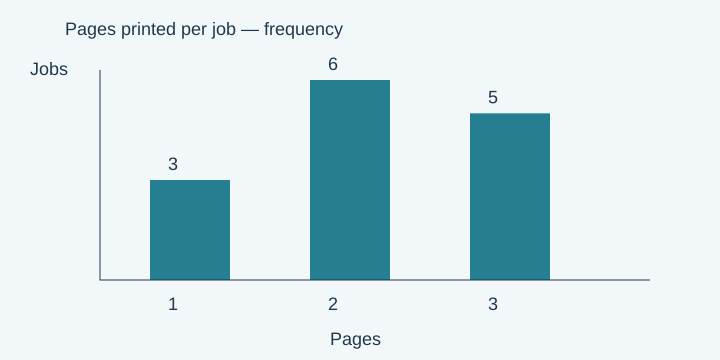
The frequency graph shows pages printed per job. What is the mean number of pages per job? (Graph version 1.) Figure data: Frequency bar graph: 1 pages: 3 jobs, 2 pages: 6 jobs, 3 pages: 5 jobs. Total jobs: 14. Total pages: 1(3) + 2(6) + 3(5) = 30. The mean is 15/7. Before calculating: A bar’s height is a count of jobs, not a number of pages.
Contrast: a different decision
The box plot displays five summary values for delivery times in minutes. What is the range? (Graph version 1.) Figure data: Box plot with min, Q1, median, Q3, max: 3, 6, 9, 15, 21. Minimum = 3; maximum = 21. Subtract the minimum from the maximum. The range is 18 minutes. Before calculating: The range uses the whisker endpoints, while the box width describes the interquartile range.
Transfer with solution
The scatter plot labels observation P and the fitted line y=2x+3. What is the residual at P, defined as observed minus predicted y? (Graph version 1.) Figure data: Scatter point P=(4,15); fitted line y=2x+3; axes are x and y.. The point is (4,15). Predicted y = 2(4)+3 = 11. Residual = 15−11 = 4. Before calculating: Evaluate the line at the point’s x-coordinate before comparing heights.
Check the boundary
A residual is observed minus predicted, not the vertical coordinate alone. The line graph records a tank volume in liters over time in minutes. What is the average rate of change between minutes 2 and 5? (Graph version 1.) Figure data: Volume line graph: (0 minutes, 3 liters), (2 minutes, 9 liters), (5 minutes, 12 liters). Volume rises from 9 to 12, a change of 3. The elapsed time is 5−2 = 3 minutes. The average rate is 1 liters per minute.
The frequency graph shows pages printed per job. What is the mean number of pages per job? (Graph version 1.)
 Open full-size diagram ↗
- Total jobs: 14.
- Total pages: 1(3) + 2(6) + 3(5) = 30.
- The mean is 15/7.
Try it, then explain it.
Complete a short set without looking at the example. After each answer, explain which operation preserved the relationship and why the result makes sense.
Sources & authorship
Original Slope explanations and examples. References support the concepts; they are not the source of copied questions. Independent educator review is pending.
GRE Quantitative Reasoning overview