
The decision and its conditions
A display packages information but does not choose the statistic for you. Bar heights count categories, histogram bins collect a range of numerical values, and a box plot marks quartiles rather than individual observations. A scatter plot pairs two measurements for each case. Read axis labels and scale before using a height or coordinate. A bin total does not identify every exact measurement inside that interval. An interquartile range measures the middle half of the data, whereas the full range uses the extremes. State what the display supports and what it leaves unknown.
Worked example
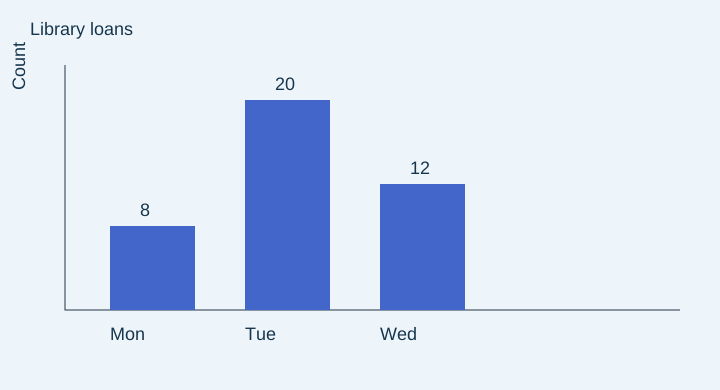
Given figure data: Library loans. Mon: 8; Tue: 20; Wed: 12. Each bar label gives its exact count. The chart shows books lent on three days in week 1. How many more were lent Tuesday than Monday? Tuesday has 20 loans and Monday 8. The comparison asks for a difference: 20−8. There were 12 more loans Tuesday.
A contrasting decision
Given figure data: Waiting-time histogram. 0–<5: 3; 5–<10: 5; 10–<15: 2; 15–<20: 4. Each bar label gives its exact count. The histogram records waiting times for session 1. How many observations have waiting time at least 10 minutes? At least ten includes the last two bins and excludes the bin ending at ten. The relevant counts are 2 and 4. Adding them gives 6 observations; exact values within each bin are not needed.
Diagnose a competing method
The first example’s tempting answer 28 follows this mistake: Add the two days instead of finding their difference. Read the two requested bar heights, then distinguish “more” from “times as many”.
Transfer before revealing
Given figure data: Delivery time (minutes). Five-number summary: minimum 2, Q1 7, median 11, Q3 16, maximum 22. The box plot summarizes delivery times in area 2. What is the interquartile range in minutes? Pause and identify the requested quantity. Solution: The first and third quartiles are 7 and 16. Interquartile range measures the width of the box, not the full whisker span. 16−7=9 minutes.
Check the boundary of the method
An interquartile range measures the middle half of the data, whereas the full range uses the extremes. Check the inclusive lower boundary and add every qualifying bin. Compare the answer with the question’s units and conditions. One correct example does not prove an identity or a statistical generalization.
The chart shows books lent on three days in week 1. How many more were lent Tuesday than Monday?
 Open full-size diagram ↗
- Tuesday has 20 loans and Monday 8.
- The comparison asks for a difference: 20−8.
- There were 12 more loans Tuesday.
Compare the other answer choices
Compare Tuesday with Wednesday instead of Monday.
Report the Tuesday total without removing Monday.
Add the two days instead of finding their difference.
Try it, then explain it.
Complete a short set without looking at the example. After each answer, explain which operation preserved the relationship and why the result makes sense.
Sources & authorship
Original Slope explanations and examples. References support the concepts; they are not the source of copied questions. Independent educator review is pending.
GED Mathematical Reasoning Assessment Guide for Educators