
Build the method
A two-way table records each person once in one cell. Row totals, column totals and the grand total serve different denominators. For a within-region transport comparison, divide each bus count by its own region total. Check that the resulting within-row percentages total one across all choices.
Worked example
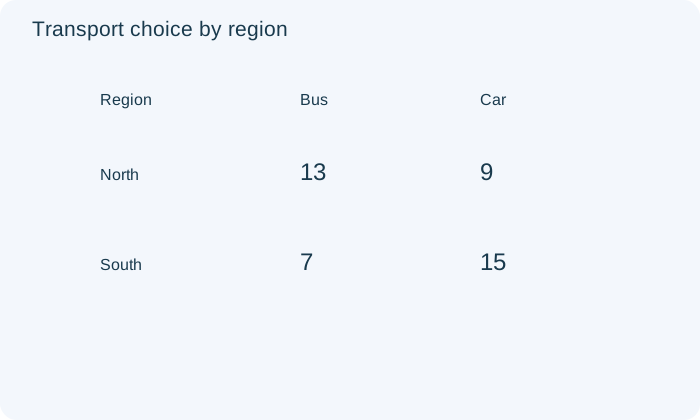
North has 13 bus and 9 car users; South has 7 bus and 15 car users. The bus rates are 13/22 and 7/22. Their difference describes an association in these observations. This calculation alone gives neither a population significance test nor evidence that region causes a transport choice.
Compare the alternatives
If another population table has A:(2 yes,3 no) and B:(4 yes,6 no), both conditional yes probabilities are 2/5. The overall probability is also 6/15=2/5. A uniformly chosen person therefore has independent group and response variables in this finite population, despite B having more yes observations.
Avoid a specific trap
Aggregates weight subgroup rates by subgroup sizes. A treatment can have a better rate in every difficulty group but a worse aggregate rate if it receives more difficult cases. This is not contradictory arithmetic. It means the aggregate comparison answers a different weighted question.
Transfer check with explanation
Transfer: with P(A)=1/2, P(B)=1/4 and overlap 1/20, P(A|B)=1/5 whereas P(B|A)=1/10. The overlap stays the same but the reference group changes. Explain which population is restricted before calculating either conditional probability.
Use the displayed two-way count table. Which conditional comparison addresses whether travel choice is associated with region?
 Open full-size diagram ↗
- Hold region fixed for each denominator, then compare the resulting choice distributions.
- North bus rate 13/22 and South bus rate 7/22 differ.
- Why an alternative fails: A single joint proportion does not compare travel-choice distributions between regions.
Compare the other answer choices
A single joint proportion does not compare travel-choice distributions between regions.
Marginal choice totals erase the regional grouping needed for association.
One region alone cannot establish whether choice distributions differ across regions.
Try it, then explain it.
Complete a short set without looking at the example. After each answer, explain which operation preserved the relationship and why the result makes sense.
Sources & authorship
Original Slope explanations and examples. References support the concepts; they are not the source of copied questions. Independent educator review is pending.
AP Statistics Course and Exam Description, effective Fall 2026