
StatQuest uses resampling to introduce confidence intervals and visual comparisons. This companion develops independent examples and separates the long-run coverage interpretation from informal probability claims. It is an original teaching extension, not a transcript or substitute for the source.
Identify the fixed target before calculating
Suppose a college wants the proportion of enrolled students who usually commute by public transport. The population proportion is a fixed but unknown number for the specified population and time. A random sample produces an estimate that varies from sample to sample. The distinction between the fixed parameter and the changing estimate is the starting point of confidence intervals.
If 120 of 200 randomly sampled students use public transport, the observed proportion is 0.60. A second random sample would probably give a different proportion. An interval aims to express the precision of the estimate under a stated sampling method. It does not account for every imaginable source of error.
Turn a standard error into an interval
For an introductory one-proportion interval, an estimated standard error is the square root of p-hat times one minus p-hat divided by the sample size. With p-hat 0.60 and n 200, this is approximately 0.0346. Using 1.96 as the critical multiplier produces a margin of error of approximately 0.0679. The approximate 95% interval is therefore 0.532 to 0.668.
This computation is appropriate only when the procedure’s conditions are reasonable. Consider random selection, independence and adequate success and failure counts. When sampling without replacement from a finite population, a small sampling fraction is commonly checked. Do not insert numbers into the formula first and invent conditions afterward.
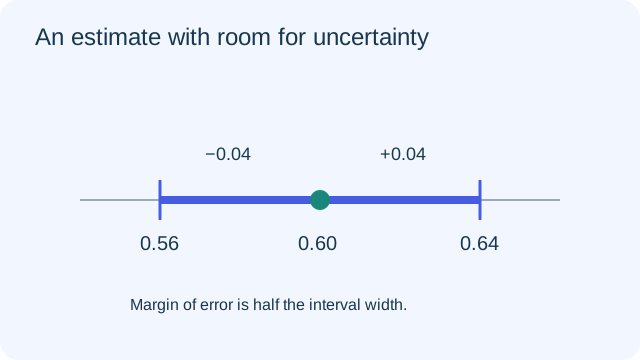
PAUSE & TRYAn estimate is 0.60 and its margin of error is 0.04. What are the endpoints?Reveal explanation
0.56 and 0.64. The full width is 0.08, not 0.04.
Read 95% as a property of the procedure
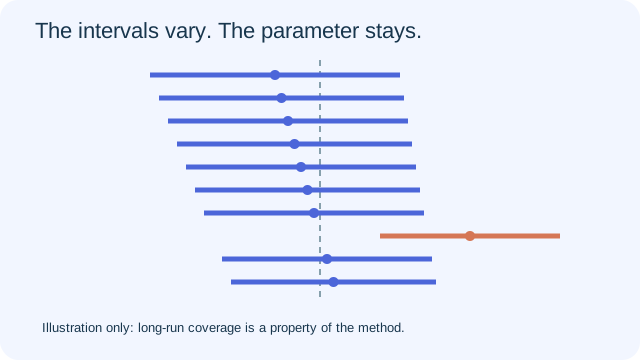
Imagine repeating the same valid sampling process many times. Each repetition creates a new estimate and a new interval. Some intervals cover the true population proportion and some miss it. A well-calibrated 95% procedure captures the fixed parameter in approximately 95% of these repeated intervals.
Once one interval has been computed, its endpoints are fixed. In the usual frequentist interpretation, the parameter is also fixed, so this particular interval either covers it or does not. Avoid saying that 95% of students lie inside the interval, or that the population proportion has a 95% chance of moving into the interval. An interval for a proportion describes a population feature, not a range of individual student outcomes.
Know what changes the width
Higher confidence usually requires a larger critical multiplier and therefore a wider interval when the same data and method are used. More confidence comes at a cost in precision. Holding the other ingredients approximately fixed, increasing the sample size reduces standard error at the rate one over the square root of sample size.
To halve the margin of error, plan for about four times as many independent observations, not twice as many. That comparison assumes a similar variability level and the same confidence procedure. It is a design rule, not a promise that every realized sample will produce exactly the expected width.
Keep resampling and sampling distinct
A bootstrap resample draws observations with replacement from the observed sample. Repeating this process can approximate how a statistic varies under repeated sampling. The collection of bootstrap estimates is useful, but it is not the original population and does not repair a badly chosen sample.
Different confidence-interval procedures use bootstrap output in different ways. A percentile interval takes selected percentiles of the bootstrap distribution; other methods correct bias or use a standardized statistic. Coverage depends on the setting and assumptions. Calling every interval the middle 95% of sample means hides important differences between procedures. The source video offers a visual introduction; the details need the additional qualifications given here.
Connect an interval to a test only when methods match
For a matching two-sided test and confidence procedure, checking whether a proposed parameter value lies outside the corresponding interval can agree with the test decision. The confidence level, significance level, parameter and statistical method must match. A one-sided claim requires different care.
Comparing the overlap of two separate intervals is not generally the same as constructing an interval for the difference between the two parameters. Overlap can occur even when a suitable test finds a difference. For a group comparison, define the difference directly and use the procedure justified by the design. Finish with the direction and size of the estimated effect, not only a significant or nonsignificant label.
Turn the idea into practice.
A fresh set will help you use the relationship with different numbers.
Practice this skillEvidence & editorial note
Real automatic captions reviewed. Some source wording treats a fixed parameter as having a probability after an interval is calculated and links interval boundaries to p-values too broadly. The original text here corrects those shortcuts. Bootstrap percentile intervals and classical intervals are not interchangeable in every setting. Full audiovisual review is pending.
Short source map; original teaching explanation, examples and original SVG diagrams.
Caption track SHA-256: 67682ff89350ec6c1d2f6b521d28f4426318304fd76e1b123354d92fb16b993c
Source segment references are retained in the catalog. Full captions remain in the local research archive.