
The source introduces coordinate pairs, slopes and the intercept form of a line. This companion uses that prerequisite idea to build original AP Precalculus reasoning. It is not a description of the current AP exam or a reproduction of the source lesson.
Begin with a change, not a formula
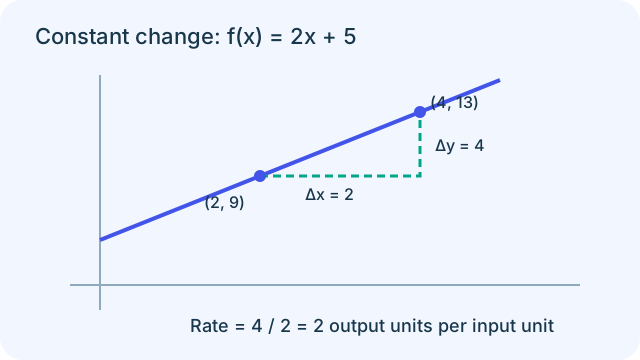
Suppose a laboratory uses a linear calibration rule f(x)=2x+5, where x is a concentration and f(x) is an instrument reading. At x=2 the reading is 9; at x=4 it is 13. The important observation is not merely that both readings are positive. Increasing the input by two raises the output by four. Dividing these changes gives two reading units per concentration unit.
The input interval belongs in the calculation. If someone reports only a difference of four, they have described an output change without describing a rate. If someone reverses only one subtraction, they obtain a negative rate even though the readings increase. Keep the endpoint order consistent. The original video supplies the basic slope vocabulary; the calibration setting and the comparisons below are our own teaching examples.
Use a nonlinear counterexample
Now replace the calibration rule with g(x)=x². From x=1 to x=3, the average rate is (9−1)/(3−1)=4. From x=3 to x=5, it is (25−9)/(5−3)=8. Both intervals have length two, yet their output changes differ. This comparison isolates what is special about a linear function: its equal-interval changes are constant.
Do not interpret the first quotient as the value of g at some unspecified point. It is a slope of the secant connecting two points. A curve contains many secants, and the requested endpoints determine which one matters. AP Precalculus reasoning often asks students to connect representations, so a table, a symbolic rule and a graph should describe the same interval before their conclusions are combined.
PAUSE & TRYFor g(x)=x², find the average rate from x=2 to x=6.Reveal explanation
8, because (36−4)/(6−2)=32/4.
Transform points before drawing curves
Consider h(x)=g(x−3)+2. A known point (1,1) on the original square function becomes (4,3): the new input four produces the old input one inside the parentheses, and the old output one is increased by two. This point-based argument is safer than memorizing that an inside minus sign somehow makes a graph move right.
The same transformation applies to every point. The original vertex (0,0) becomes (3,2). A vertical translation changes both endpoint outputs by the same amount, so it cancels in an average-rate calculation over corresponding shifted intervals. A vertical stretch does not cancel: multiplying all outputs by a factor multiplies every secant slope by that factor. Track these effects separately before combining them.
Keep composition separate from multiplication
If f(x)=2x+5 and g(x)=x², then f(g(3))=f(9)=23. In the opposite order, g(f(3))=g(11)=121. The two expressions use the same functions and the same starting input, but the sequence of operations is different. Writing the intermediate output prevents an order error and makes your reasoning visible.
The product f(3)g(3) would instead be 11×9=99. A small notation difference therefore changes the mathematical task. When working without a calculator, write each function application on a separate line. With technology, use parentheses to show the nesting explicitly rather than relying on the default order of a typed expression.
PAUSE & TRYWith these same functions, what is f(g(2))?Reveal explanation
13: first square 2 to get 4, then compute 2(4)+5.
Interpret the result and test its limits
Returning to the calibration model, f(0)=5 is an intercept. It is a model prediction for zero concentration, not necessarily a reading that was measured. If the calibration data only covered concentrations from two to four, extending the line to zero is extrapolation. The algebra can calculate a number without proving that the instrument follows the same relationship there.
A useful written answer names the requested quantity, gives its units and states the relevant interval or domain. Then perform a second check: substitute endpoints, compare a graph, or reason about whether the sign and scale make sense. This companion practices foundational reasoning rather than a complete AP free-response rubric. In a full response, explaining why a model fits a context can be as important as obtaining the final numerical output.
Try a representation check
Make a four-column table with input, original output, transformed input and transformed output. For g(x)=x², use inputs zero, one and two. For h(x)=g(x−3)+2, the corresponding new points are (3,2), (4,3) and (5,6). Check each point by substitution rather than assuming the picture is correct. Now compare the first and second one-unit intervals: the new output changes are one and three. Their inequality confirms that translating the curve did not make it linear. Explain this observation in one sentence before moving to a new practice set. A table can expose a mistaken shift more clearly than a neatly drawn but incorrectly labeled graph.
Transfer from linear change to periodic change
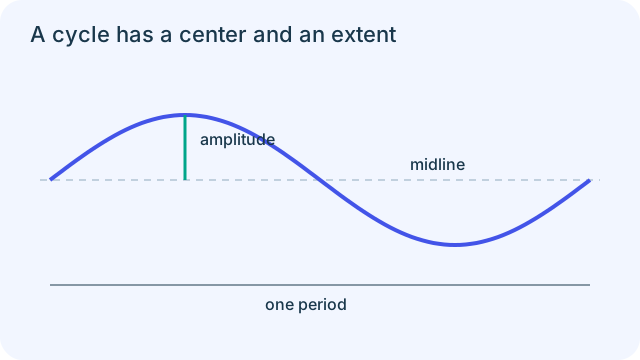
The same habit of naming the input interval helps with a repeating model. In the schematic below, the dashed midline separates upper and lower motion, the vertical marker shows amplitude, and the horizontal span shows one full period. Equal input steps need not produce equal output changes in a sinusoid. Compare matching positions one period apart instead: their outputs repeat. This extension is our original AP teaching, beyond the source video’s linear focus.
Turn the idea into practice.
A fresh set will help you use the relationship with different numbers.
Practice this skillEvidence & editorial note
Existing caption evidence is explicitly reused from the SAT pilot because these algebra prerequisites also support AP Precalculus. The teaching prose, examples and diagrams here are newly authored. Automatic captions can corrupt notation; examples are independently computed. Full audiovisual review remains pending.
Original exam-specific teaching companion with a brief source synopsis.
Caption track SHA-256: 950946b8f5c3b339f834de1c5cb2510c365a313ba18bcb0e1aae568aae2f77b2
Source segment references are retained in the catalog. Full captions remain in the local research archive.